K-pop Twitter Network Analysis
An interactive network visualization exploring the Twitter connections between K-pop celebrities, revealing how artists from different entertainment companies interact and influence each other in the digital space. This project applies network analysis principles to understand social media dynamics within the Korean entertainment industry.
Role: Data Visualization Developer
Organization: Self-Initiated
Date: 2020
Tools: D3.js, JavaScript, HTML/CSS, Network Analysis
Status: Completed
K-pop has become a global phenomenon, with artists amassing millions of followers on social media. However, understanding the relationships and influence patterns between these celebrities remains challenging due to the sheer scale of interactions and the complexity of entertainment industry dynamics.
Key questions I wanted to explore:
- How do K-pop artists from different entertainment companies connect on Twitter?
- Which celebrities are the most central and influential in the network?
- What patterns emerge when visualizing artist relationships by company affiliation?
- How can network analysis reveal hidden connections in the K-pop ecosystem?
The challenge was creating an intuitive, interactive visualization that could reveal these patterns while remaining accessible to non-technical users interested in K-pop culture.
I built this visualization end-to-end, combining data collection, network analysis, and frontend development:
- Data Collection: Scraped Twitter follower data for 25+ top K-pop celebrities from Allkpop rankings
- Network Construction: Built connection matrix based on mutual follows and interactions
- Visualization Design: Created interactive D3.js force-directed graph with custom styling
- Centrality Analysis: Implemented network metrics to identify key influencers
- UX Enhancement: Added search, zoom, hover details, and mobile responsiveness
Frontend (D3.js + Vanilla JS):
- Force Simulation: D3.js force-directed layout with custom gravity and collision detection
- Node Styling: Color-coded by entertainment company (SM, YG, JYP, Big Hit, etc.)
- Interactive Features: Drag, zoom, pan with smooth transitions
- Responsive Design: Mobile-friendly with pleaserotate.js for orientation handling
- Performance: Optimized rendering for 25+ nodes with 100+ connections
Network Analysis:
- Degree Centrality: Identified most connected artists
- Betweenness Centrality: Found bridge connectors between companies
- Community Detection: Visual clustering by company affiliation
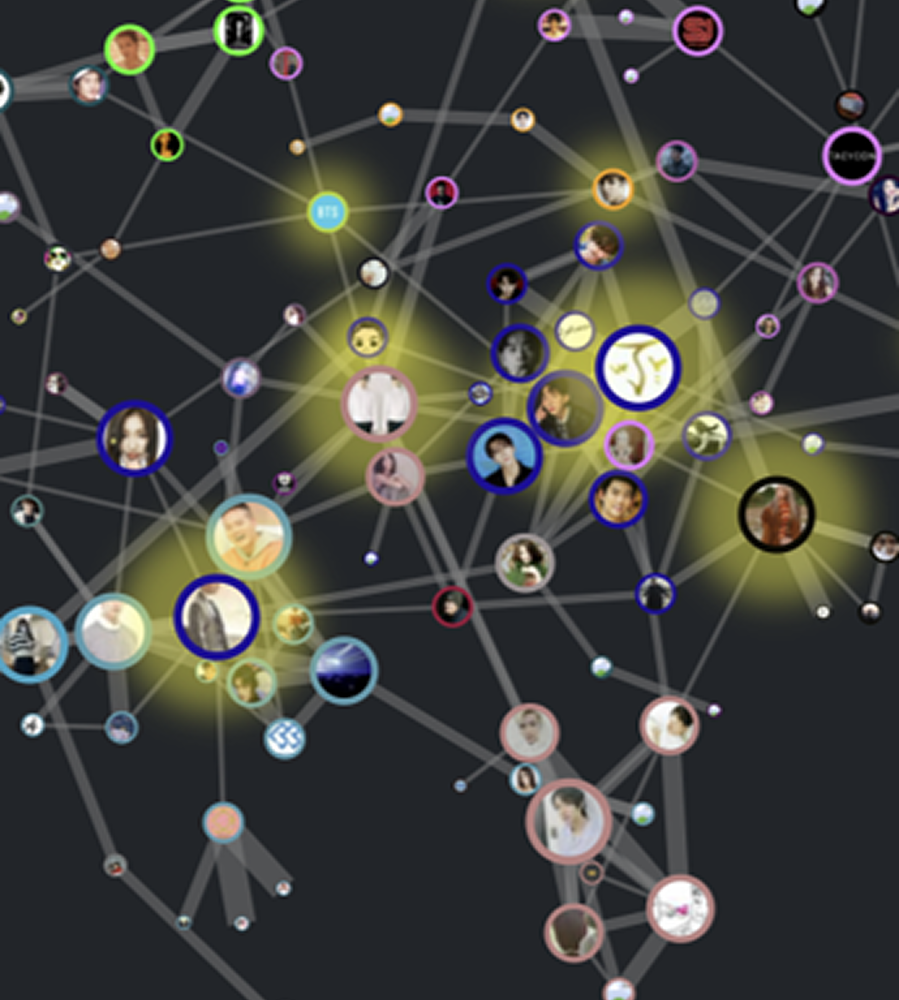
- Influence Highlighting: Yellow glow effect for top influencers
- Interactive Network Graph: Force-directed visualization with smooth physics-based animations
- Celebrity Profiles: Hover to see name, group affiliation, and company details
- Connection Discovery: Click any artist to highlight immediate network connections
- Smart Search: Find any K-pop celebrity by Twitter handle
- Influencer Spotlight: Top influencers visually emphasized with glowing effect
- Company Color Coding: Instant visual identification of entertainment company clusters
- Mobile Optimized: Full touch support with rotation guidance for best viewing
The network visualization revealed several interesting patterns in the K-pop Twitter ecosystem:
- Company Clustering: Artists from the same entertainment company tend to form tight-knit clusters, reflecting both professional relationships and promotional strategies
- Cross-Company Bridges: A few key artists serve as connectors between different companies, often through collaborations or personal friendships
- Influencer Hierarchy: The most central nodes weren’t always the most followed, indicating that connection patterns matter as much as follower count
- Group vs Solo Dynamics: Group members typically cluster together, while solo artists often have more diverse connection patterns
This project was my deep dive into network analysis and D3.js visualization. I learned how to translate complex graph theory concepts into intuitive interactive experiences. Working with force simulations taught me the importance of performance optimization when rendering dynamic visualizations.
Key technical learnings:
- D3.js force simulation parameters and tuning for optimal layouts
- Network centrality metrics and their real-world interpretations
- Balancing visual aesthetics with information density
- Mobile-first design for data visualizations
The project also deepened my appreciation for how social network analysis can reveal hidden structures in cultural phenomena. K-pop isn’t just about music—it’s a complex ecosystem of relationships, and network visualization brings those patterns to life in an engaging, explorable format.
Interactive D3.js visualization exploring Twitter connections between 25+ K-pop celebrities, revealing network patterns by entertainment company
Task
Build an interactive network visualization to explore K-pop celebrity Twitter connections and identify key influencers